How to Implement Chart.js in Odoo (Step-by-Step Guide)
- Muhammad Kashif Rao
- Sep 26, 2025
- 1 min read

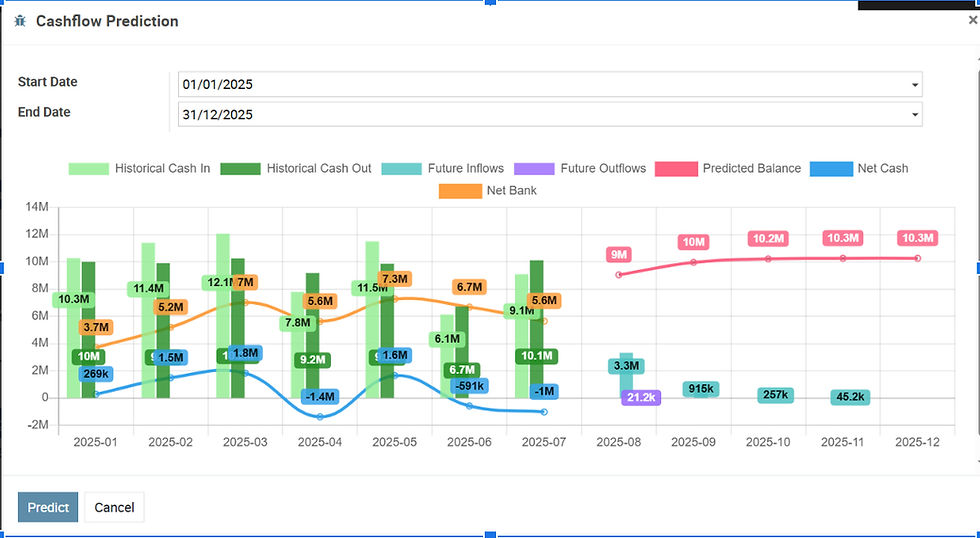
Visualizing data effectively can transform raw numbers into actionable insights. One of the simplest yet powerful ways to achieve this in Odoo is by integrating Chart.js, a lightweight JavaScript charting library.In this guide, we’ll walk you through how to embed Chart.js in your Odoo module and render dynamic charts directly from your data models. We'll also explore a real-world use case: building a Sales Analysis Dashboard.
Why Chart.js?
- Lightweight and easy to use
- Supports responsive and interactive charts
- Support multiple chart type in the single chart, eg, Bar and line chart, in the same chart.
Step 1: Get Chart.js
Download the Chart.min.js file from https://www.chartjs.org/docs/2.9.4/ and place it inside your module’s static/lib/ folder:

Step 2: Import Chart.js into Odoo Assets
In your views/assets.xml, add:

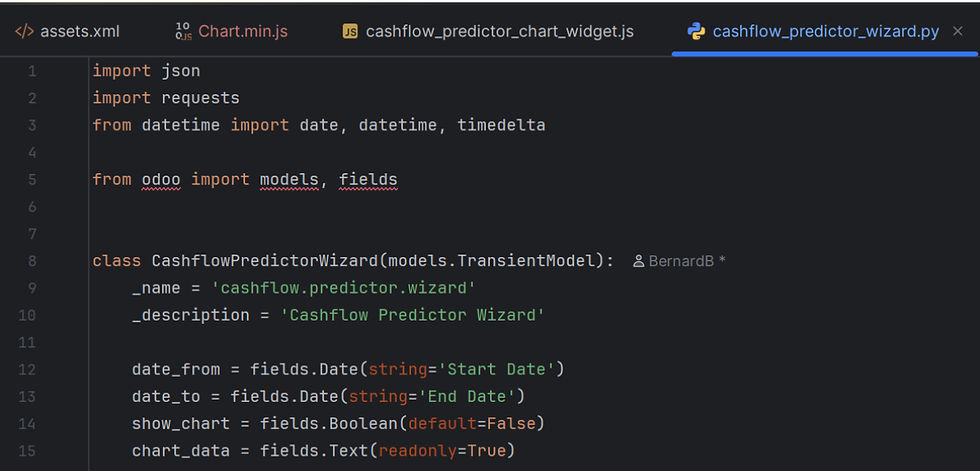
Step 3: Add Fields in Your Wizard (Python Side)
In wizard.py, add fields to store JSON data and a flag:
Step 4:
Retrieve all the data from database that you want to show in the chart and insert in JSON variable

Step 5:
Set show_chart to true and set the chart_data value from the JSON variable

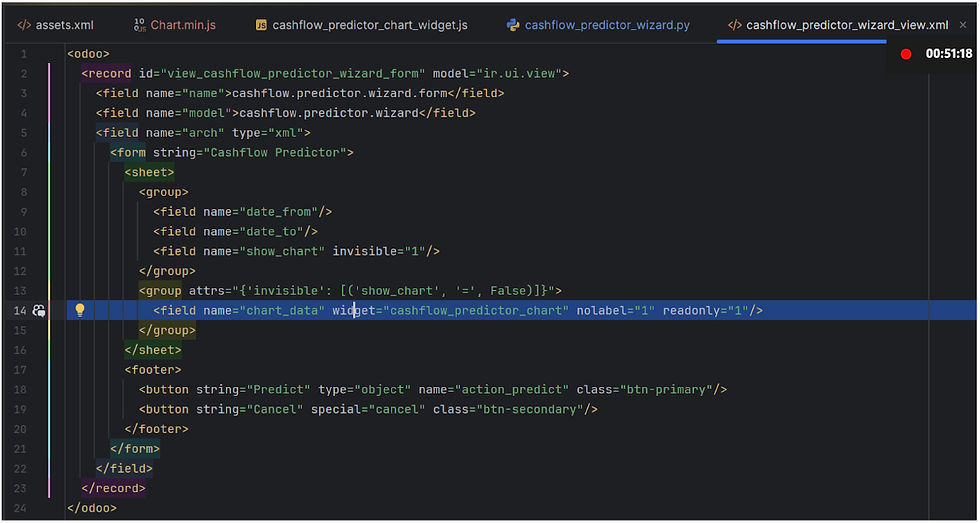
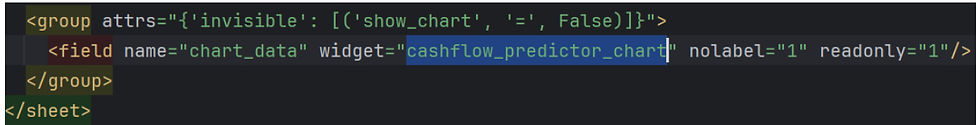
Step 6:
In cashflow predictor wizard xml, i will only show the chart_data if the show_chart is True (when all the data is already retrieved)
Step 7:
Add a .js file inside static/src/js to render the chart from json

Step 8:
Make sure fieldRegistry.add('cashflow_predictor_chart', CashflowChart); same as the widget attribute’s value

Step 9:
Import the .js file in assets.xml


Comments